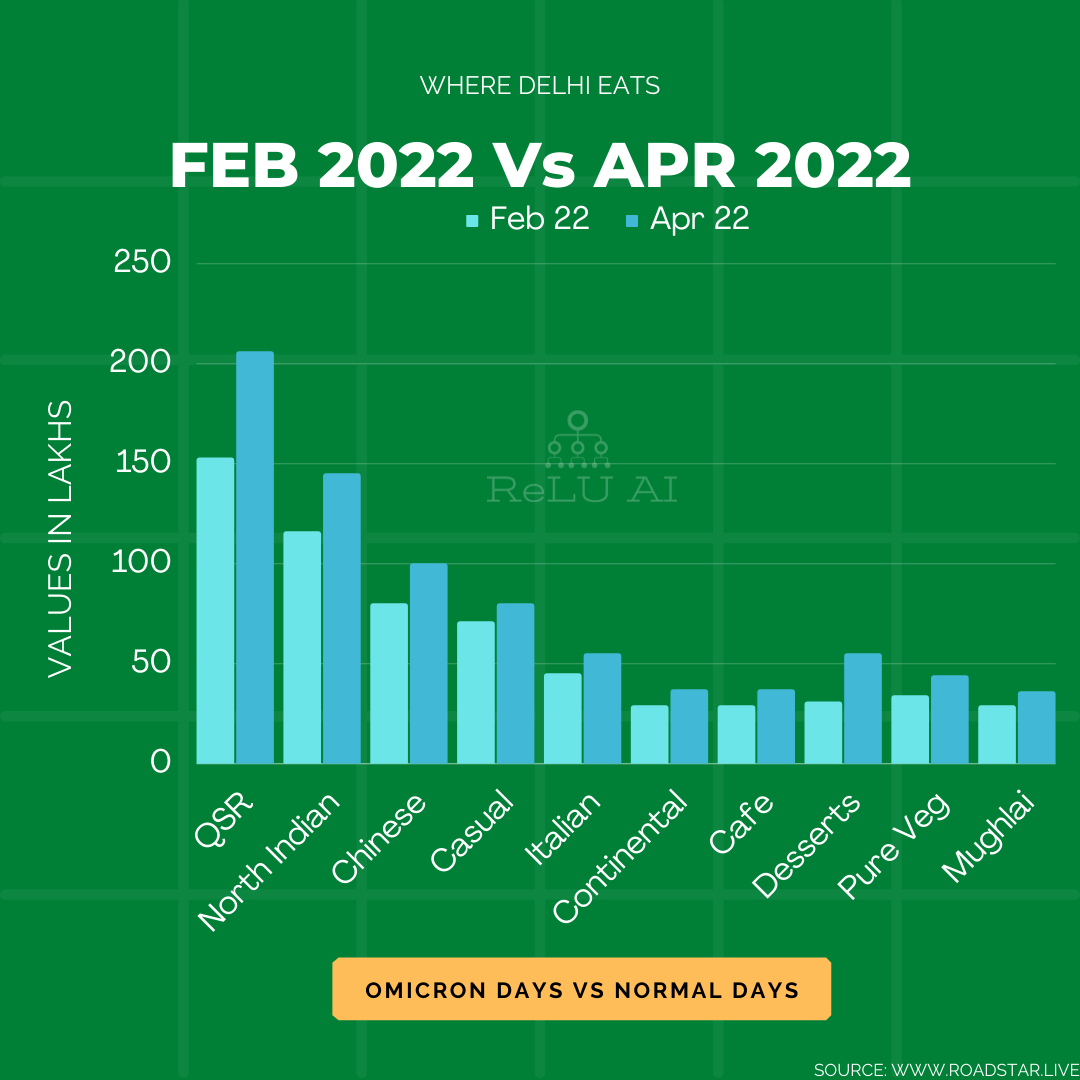
Where Delhi eats – Omicron vs Normal days is our attempt to explore on how consumer behavior had changed between Feb 2022 and April 2022. February 2022 was a cusp month between confusing omicron orders on following appropriate covid behavior, to a higher relaxation of markets for free movement in March and April 2022. These months, we could see people swarming every possible location for entertainment, picnic spots and shopping districts, as if they are taking a vengeance on 2 years of lockdown.
The josh of going to a food counter to eat is a different experience especially if it is not a working lunch. We compared the footfalls between Feb 2022 and April 2022 for the same set of outlets in Delhi. (If you are interested in exploring what transpired in Feb 2022 please visit: Where Delhi Eats)
Across all these categories of restaurants, the footfalls have jumped 25% to 70% between Feb and April 2022. Besides, the jump in numbers reiterates the earlier benchmarks that we derived for the month of Feb 2022.

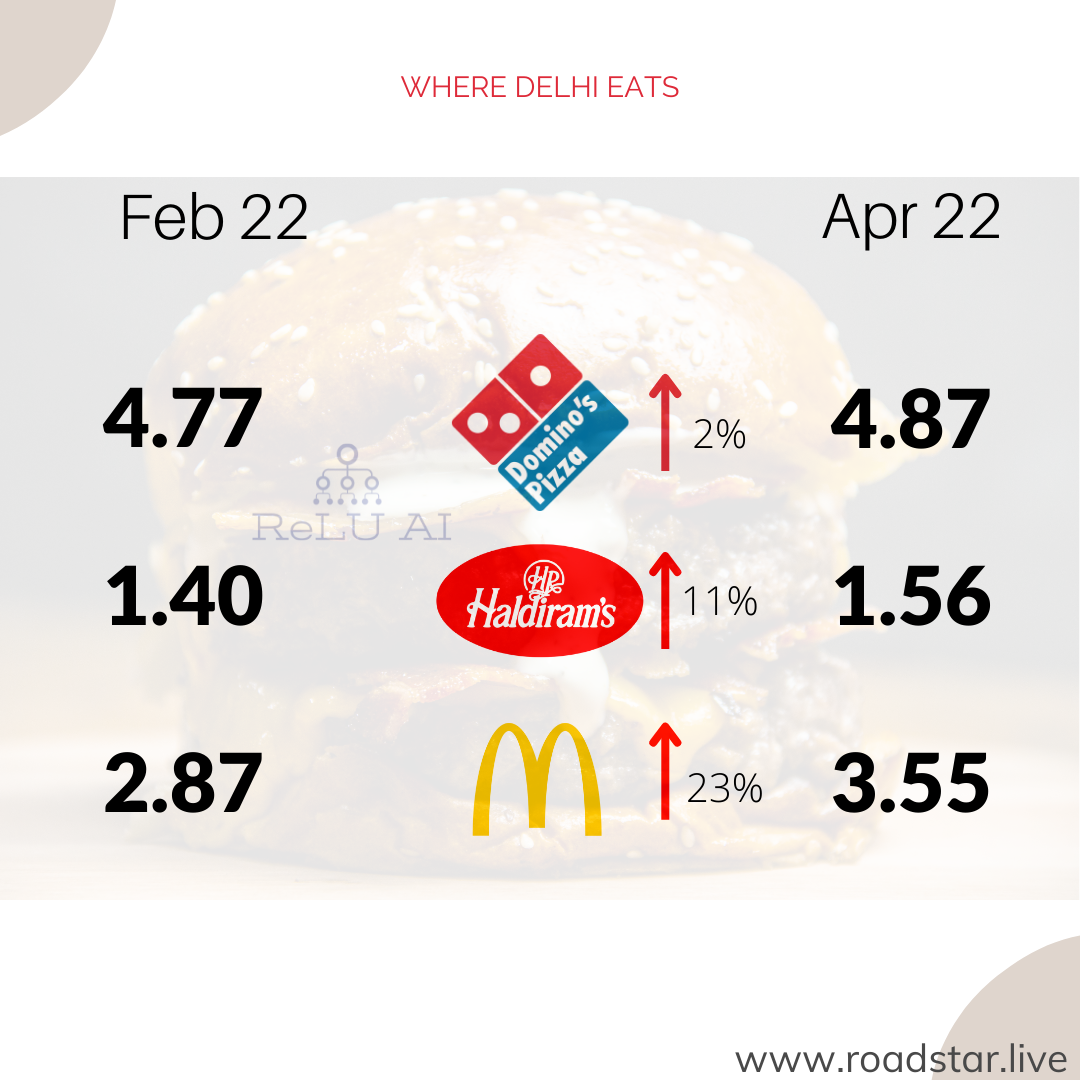
Let’s take an example of comparing McDonald’s with Haldiram’s. If my understanding about the audience these brands cater to is correct – both targets Urban and Upmarket consumers in different age bands.
McDonald’s – 12-28 years
Haldiram’s – 26–45 years

Based on these two parameters – a trained account planner can use other consumer nuances that describes them a bit more vividly.
The increase in footfalls within Haldiram’s and Dominos are comparable though, the jump was phenomenal in McDonalds between February 22 and April 22. Though these numbers do not indicate the business volumes but only the footfalls, deriving an indicator on the business volumes won’t be hard. If I were to derive sales volumes based on these footfall numbers, I would use the menu card to derive the average ticket size of their merchandise and thereby calculate an approximate volume. But that analysis is for later date.
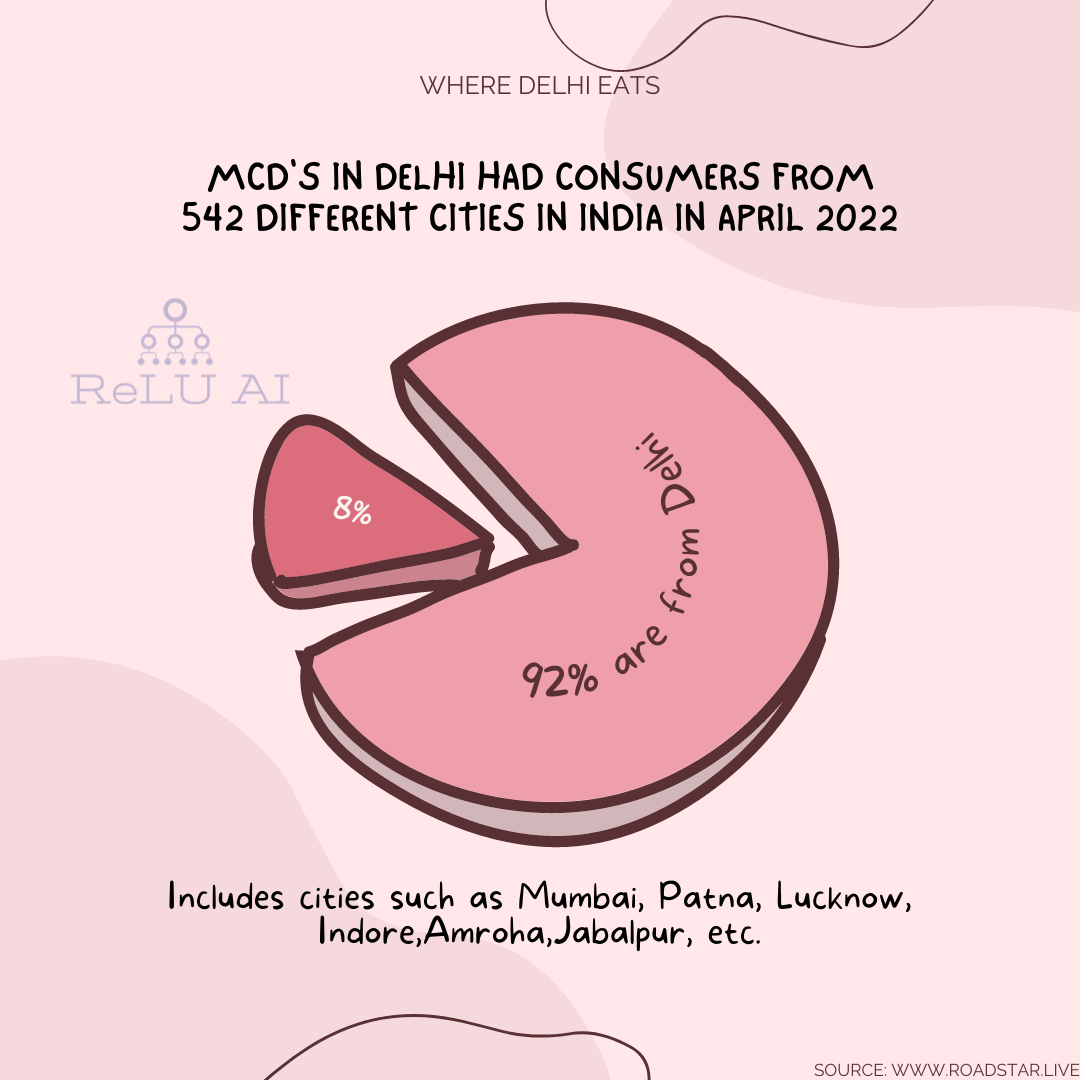
Are all these consumers from Delhi? This is an important question to understand especially when we are calculating the footfalls in prominent locations where the catchment goes beyond the city where it is located.

The city analysis of footfall indicates the consumers walked into McD’s in Delhi from all over India. We could gather footfalls from consumers as many as 542 different cities in the month of April 2022.
About RoadStar: is a data application that provides location intelligence. RoadStar reports 12500 OOH media sites and 205000 retail establishments across 30 markets spanning 70 super categories within Retail.